

Most audit teams report the same way every month: export to Excel, build the pivot, format the summary, paste it into a deck, and hope nothing changed between the export and the meeting. The work is real, it takes hours, and it is obsolete the moment someone closes an issue.
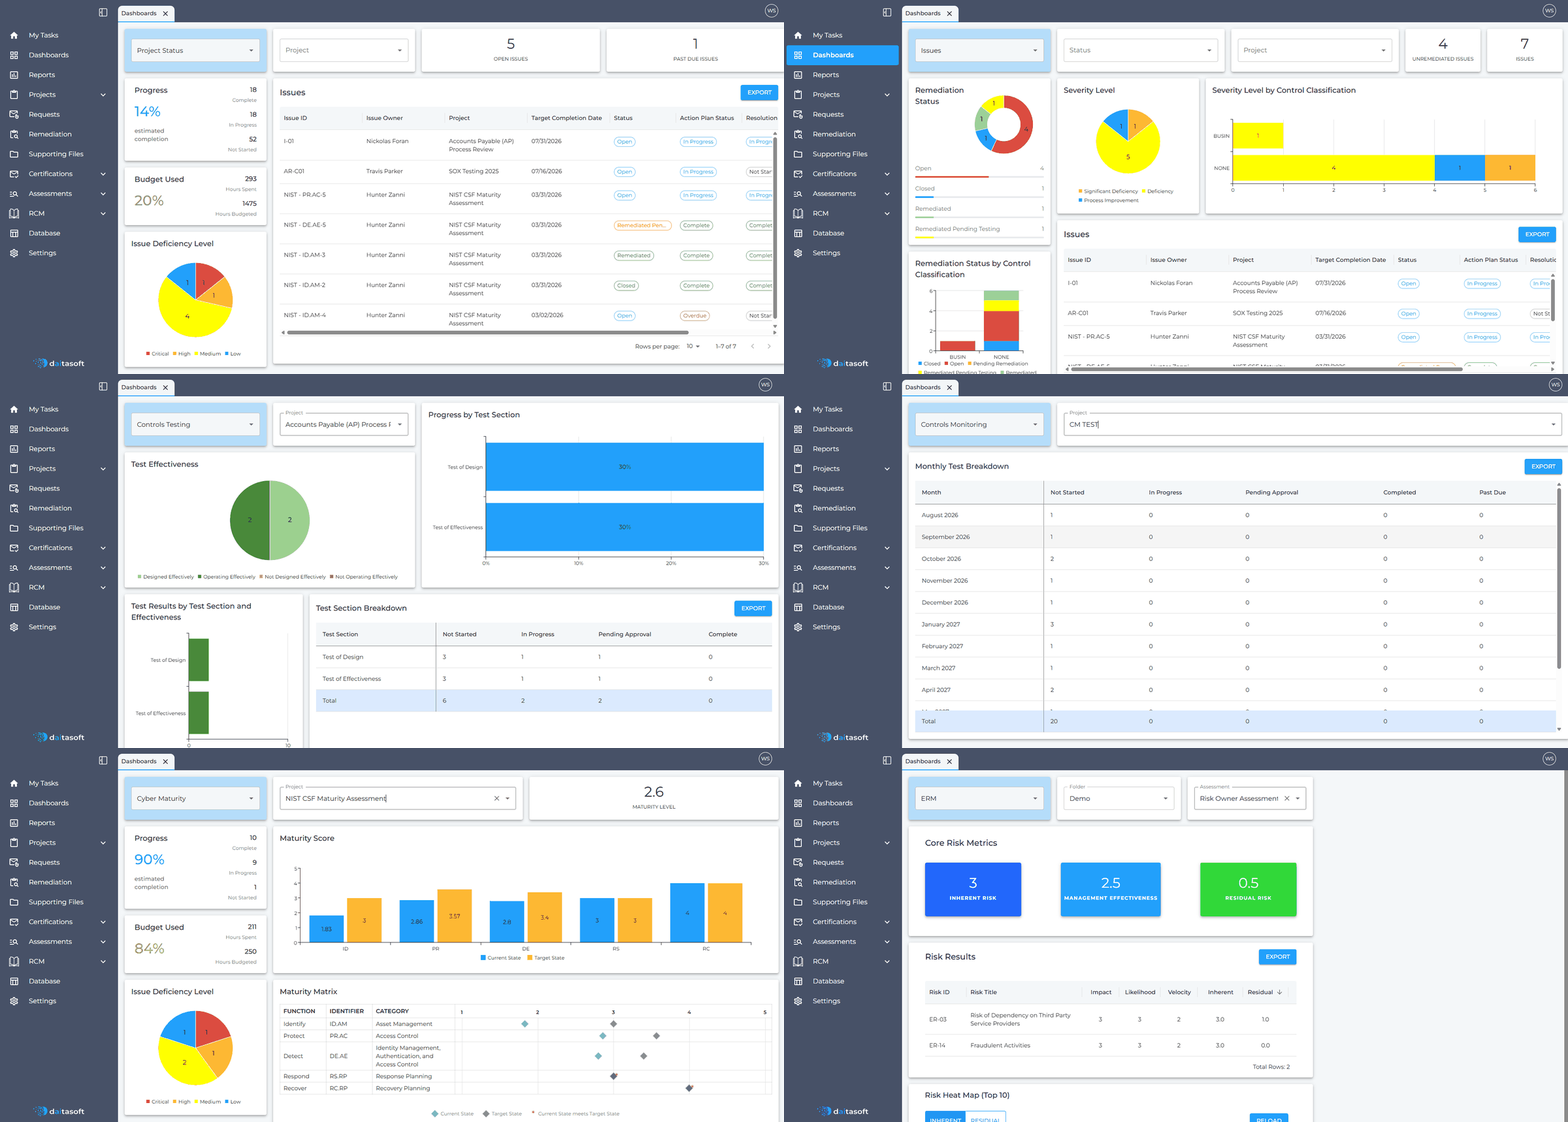
daitaGRC ships with preconfigured dashboards covering project status, issues, controls testing, controls monitoring, cyber maturity, and enterprise risk. Nothing to configure, nothing to build. Pick a dashboard, filter to what you need, and the view is current as of right now.
Project Status
The default view for anyone managing an engagement. It answers the three questions a partner asks first:
- Progress: Percentage complete, with counts of steps completed, in progress, and not started.
- Budget Used: Hours spent against hours budgeted, with the percentage consumed.
- Open and Past Due Issues: Counts surfaced at the top of the view rather than buried in a list.
- Issue Deficiency Level: Distribution across critical, high, medium, and low.
- Issues Register: The full issue list, filterable and exportable.
Budget and progress side by side is the useful part. Twenty-six percent of hours spent against fourteen percent completion is a conversation worth having in week three, not at the end of fieldwork.
Issues
A dedicated view of the remediation population, filterable by issue, status, and project:
- Remediation Status across open, closed, remediated, and remediated pending testing.
- Severity Level across significant deficiencies, deficiencies, and process improvements.
- Severity Level by Control Classification, showing where the most serious findings cluster.
- Remediation Status by Control Classification, for progress by control area.
Controls Testing
Built for teams working through a testing population:
- Test Effectiveness: Designed effectively, operating effectively, not designed effectively, and not operating effectively.
- Progress by Test Section: Completion percentage for test of design and test of effectiveness.
- Test Section Breakdown: A table of not started, in progress, pending approval, and complete, by section.
The pending approval column is the one reviewers use. It separates work that is genuinely done from work that is waiting on someone.
Controls Monitoring
For continuous and recurring testing, broken out by month:
- Monthly counts of not started, in progress, pending approval, completed, and past due.
- Running totals across the monitoring period.
Recurring control testing fails quietly — a monthly test gets skipped and nobody notices until year-end. A month-by-month view makes the gap obvious in the month it happens.
Cyber Maturity
For NIST CSF and similar maturity assessments:
- Maturity Score: Current state against target state for each function — Identify, Protect, Detect, Respond, Recover.
- Maturity Matrix: Category-level current and target positioning on a one-to-five scale, flagging where current state already meets target.
- Progress and Budget for the assessment itself.
Enterprise Risk
The ERM view, filterable by folder and assessment:
- Core Risk Metrics: Inherent risk, management effectiveness, and residual risk as headline scores.
- Risk Results: Every risk with impact, likelihood, velocity, inherent, and residual ratings.
- Risk Heat Map: The top ten risks plotted on a likelihood-by-impact grid, with a toggle between inherent and residual.
That toggle is the whole point of a heat map. Showing inherent and residual on the same grid demonstrates what the control environment is actually doing, rather than asserting it in a paragraph.
Why This Matters
- No build time. The dashboards are preconfigured. There is no report to assemble each cycle.
- Always current. Views reflect the underlying data as it stands, not as of the last export.
- Filterable. Narrow by project, status, folder, or assessment without touching the underlying data.
- Exportable. Any register behind a dashboard exports when someone needs the detail.
- Consistent. Every engagement reports on the same basis, so results are comparable across projects and periods.
Reporting as a Byproduct
The dashboards are not a separate reporting exercise. They read the same records the team is already updating as work progresses, which means the status view is a byproduct of doing the work rather than a task on top of it.
Less time assembling the report. More time on what it shows.